Drive the fields that need you, not the whole rota.
Crop Stress Map reads every client field each week in red-edge and NIR and tags the stress it finds as nitrogen, water or salinity. You get a shorter scouting list before you start the truck.
Driving the rota
With Crop Stress Map
- GSD
- UAV, under 10 cm
- Cadence
- Weekly
- Flown by
- Drone or crewed aircraft
- Spectral
- Multispectral
Every field, every week
Your client list sets the route. Each field gets a stop, a walk through it and a few plants pulled, whether or not anything is wrong. The stress you are looking for often doesn't show from the cab until the correction window has narrowed.
A drone flight over a field you already doubt helps with that one field, and a coarse satellite layer tells you something is off without telling you where. Meanwhile the healthy fields keep costing you route time.
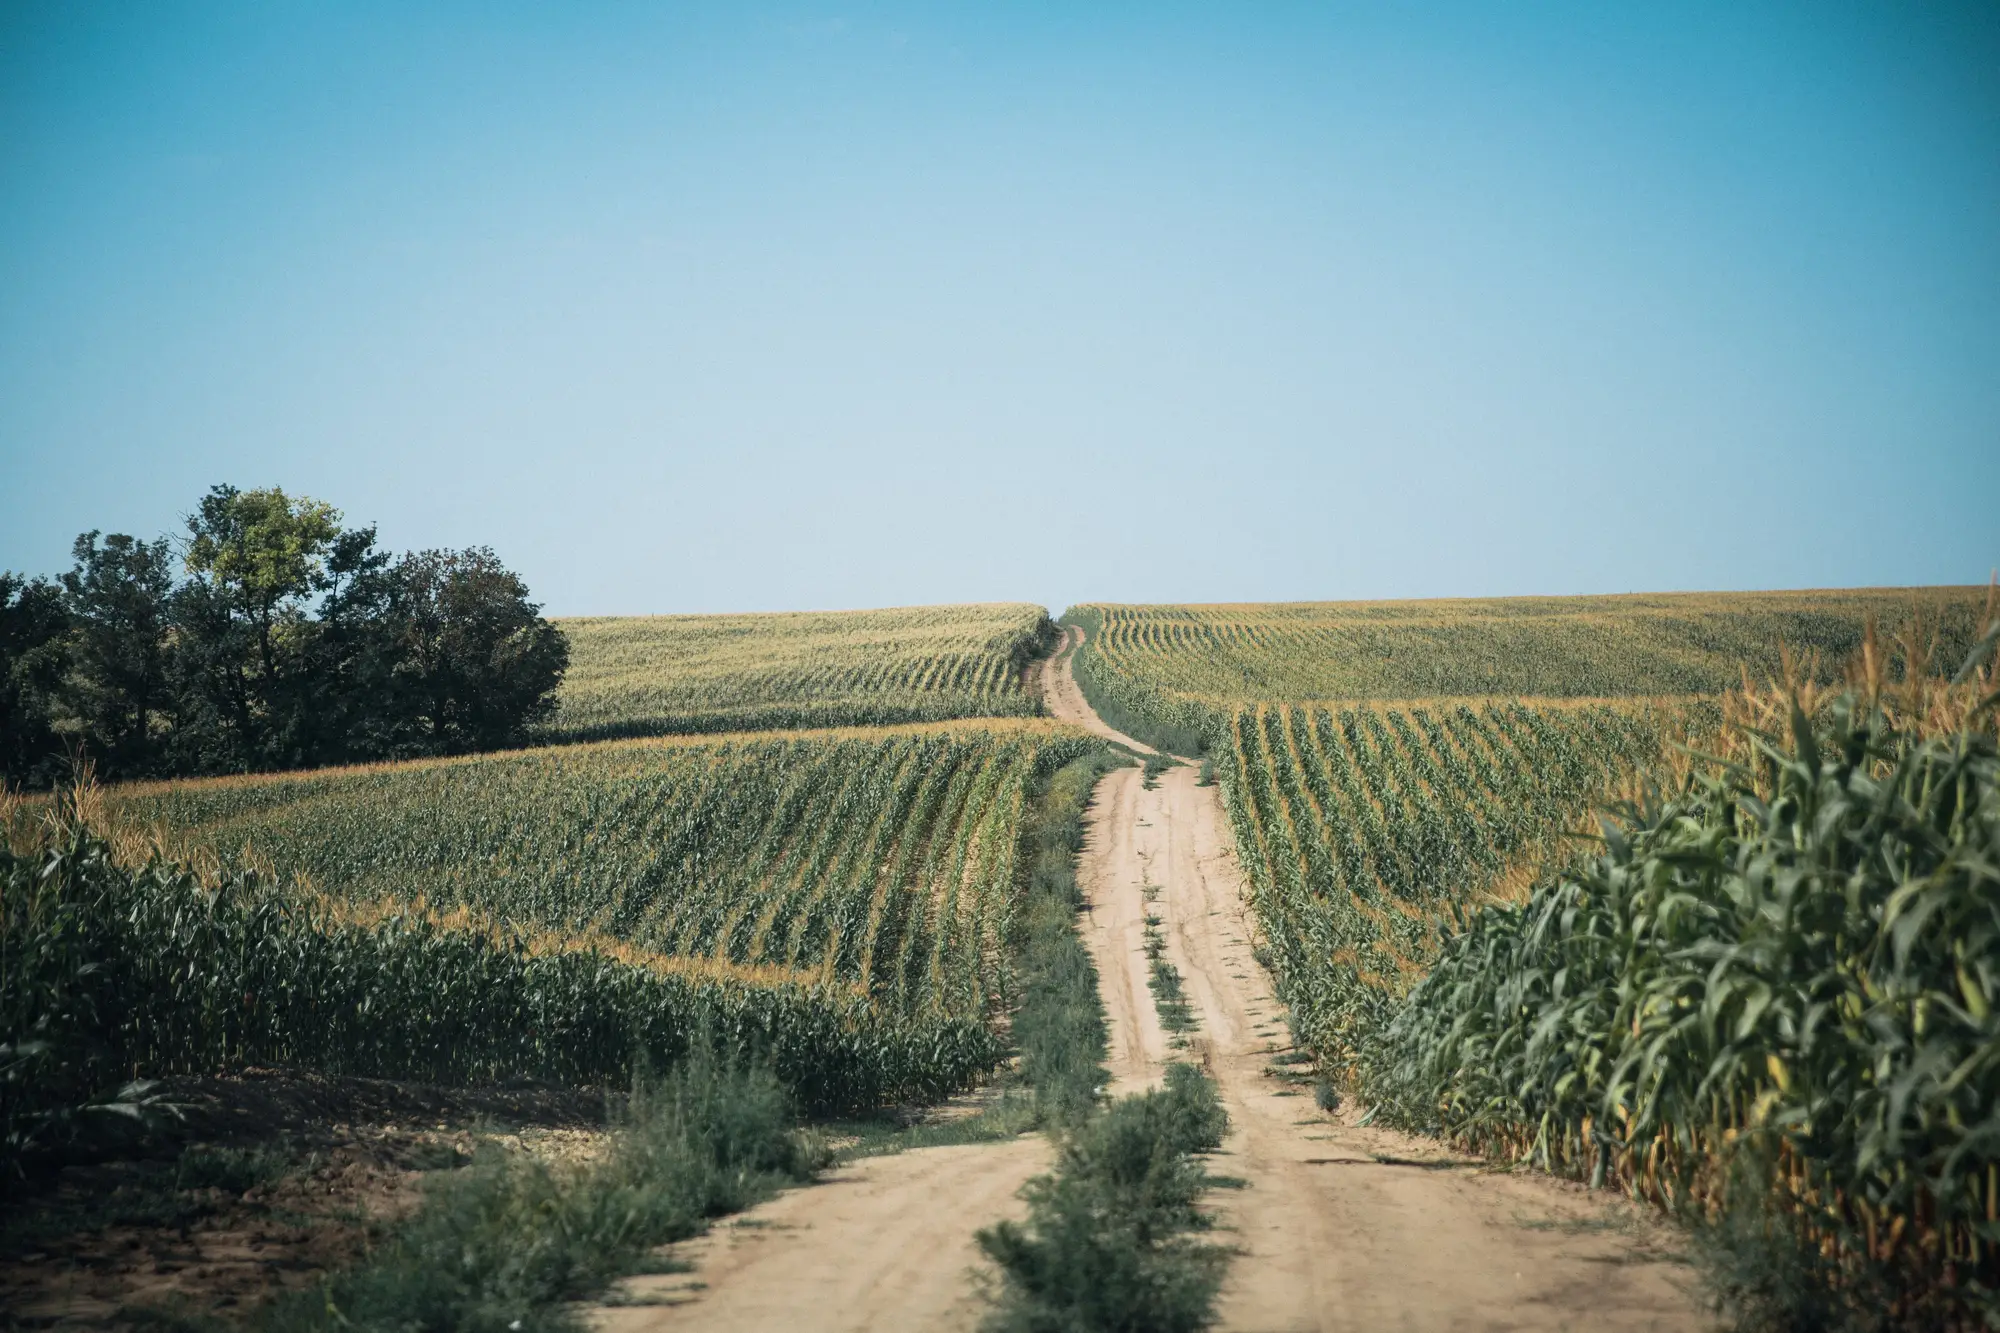
The same week, planned two ways
| Step | Driving the rota | With Crop Stress Map |
|---|---|---|
| 01Picking this week's list | All the client fields, in the order the route has always run, plus any a client phoned about. | A scouting shortlist, fields ranked by how much stress the flight found. You start with the top of it. |
| Still yoursDeciding which fields you visit regardless, because a client asked or a stage is coming up. | ||
| 02Finding the patch | Walk in from the road and hope the Z or W pattern crosses it. | The stress map shows where inside the field the canopy is off, so you walk to the patch. |
| 03Guessing the cause | Look at the leaves, think back over rain, fertilizer dates and soil type, and make a call. | Each patch carries a tag for the likely cause: nitrogen, water or salinity, read from its red-edge and NIR signature. |
| Still yoursThe call itself. The tag is a starting point for your reading of the plants. | ||
| 04Tissue and soil samples | Pull them where something looked wrong. | Pull them from the tagged patch, and from a clean patch next to it for comparison. |
| Still yoursThe lab result. It confirms the cause. The map never does. | ||
| 05Catching what changed | Compare against your notes from last visit, if you made them. | A change-since-last-week layer shows which patches grew, which shrank and which cleared. |
| 06Reporting to the client | Notes and photos from the walk, written up after. | A map for each field that goes in the report next to your findings. Your findings still lead. |
What lands each week
One set per client field, each week the flights run.
GeoTIFF or GeoJSON
Stress map
Each field drawn with stressed canopy picked out and tagged nitrogen, water or salinity. It replaces the drive-by guess when you decide where to walk.
Ledger rowFinding the patchGuessing the cause
CSV
Scouting shortlist
Your client fields ranked by stress severity this week. It sets the top of the route and leaves the rest of the list for when time allows.
Ledger rowPicking this week's list
GeoJSON
Change since last week
What moved in each field: patches that grew, patches that came back. It tells you whether last week's correction is doing anything.
Ledger rowCatching what changed
Pass note
Flight note
The date each field was flown and any part of a field the flight couldn't read, so you know how fresh each map is.
Ledger rowReporting to the client
Through your season
You send the fields once. The maps come back on the rota you set.
Before the first flight
Send your client fields
Boundary files, or a list of fields with where they sit. Tell us the crop and rough growth stage for each.
Set the season
When you want the weekly run to start and when to stop. That sets the flight weeks, and a tissue-sampling date you already have planned can sit inside them.
Every week
Weekly flight
A UAV or crewed-aircraft multispectral pass over each field at under 10 cm, checked against the week before.
Maps go out
Stress maps, shortlist and change layer arrive together once the week's flight is processed.
You scout the shortlist
Walk the tagged patches, sample, confirm and write your recommendation. The run stops when the season you set ends.
What driving the fields still does better
Read these before you cut a field off the route.
- AWeather moves the flight
- The imagery is optical. It needs daylight and low cloud. A scheduled flight can slip to the next clear window, and the flight note says which fields are on older imagery. Being in the field never has that problem.
- BA signature, not a diagnosis
- The map separates broad stress types by how the canopy reflects red-edge and NIR light. It never names a disease or a pest, and it can't tell two causes apart when they overlap in one patch. A tissue or soil test is what closes it.
- CUnder 10 cm reads patches
- At sub-10 cm you see patches inside a field, but not a single plant with a problem. Anything below the canopy is out of sight.
- DField by field
- This is a flight over the fields you list, not regional coverage. A field you didn't send isn't in the map.
- EWeekly is the target
- We plan to a weekly cadence through the season you set. It is not a live feed and carries no delivery hour.
Switch if
- You are an independent consultant or run a small practice scouting client fields on a weekly rota.
- You want the scouting list shorter and the patches marked before you start the truck.
Stick with driving the rota if
- You need a diagnosis of a named disease or pest. The map tags broad stress types only.
- You need a yield estimate or a guarantee.
- You scout one field and would rather fly it yourself.
Before you change the route
Does the map confirm the cause?
No. It separates nitrogen, water and salinity stress by reflectance signature. The tissue or soil test still closes the loop, and you make the call.
How do we check it against our own scouting?
Take the shortlist out for the first few weeks and compare it with what you find on foot. If a field looks wrong on the map, send it back and we will go through that week's imagery with you.
Can weather delay a week's flight?
Yes. Optical needs daylight and low cloud. A flight can slip to the next clear window, and the flight note marks which fields are still on older imagery.
What resolution is this?
UAV or crewed-aircraft imagery at under 10 cm. Fine enough for patches inside a field. It isn't satellite coverage.
Is there an accuracy number?
No. The map flags a signature. It doesn't grade itself, so check it against your own tests.
Will it load into our farm software?
There's no direct integration. Files are GeoTIFF, GeoJSON and CSV, which most GIS and farm software opens.
Can I use it for my clients' fields across several farms?
Yes. Send the boundary of each client field and we run them as one list.
Who owns the maps, and can I put them in client reports?
Your boundaries stay yours. What you can do with the map files, and the terms on the imagery, are written into the project agreement before the first flight.
How is it priced?
It depends on how many fields, their size and how many weeks. We quote once we've seen the list. There's no price list on this page.
Send us the client list before the next flight window.
Send field boundaries, crops and when you want the weekly run to start. We will scope the flights from there.