Scouting notes
Notes on in-season scouting, tissue sampling and reading red-edge imagery for crop consultants.
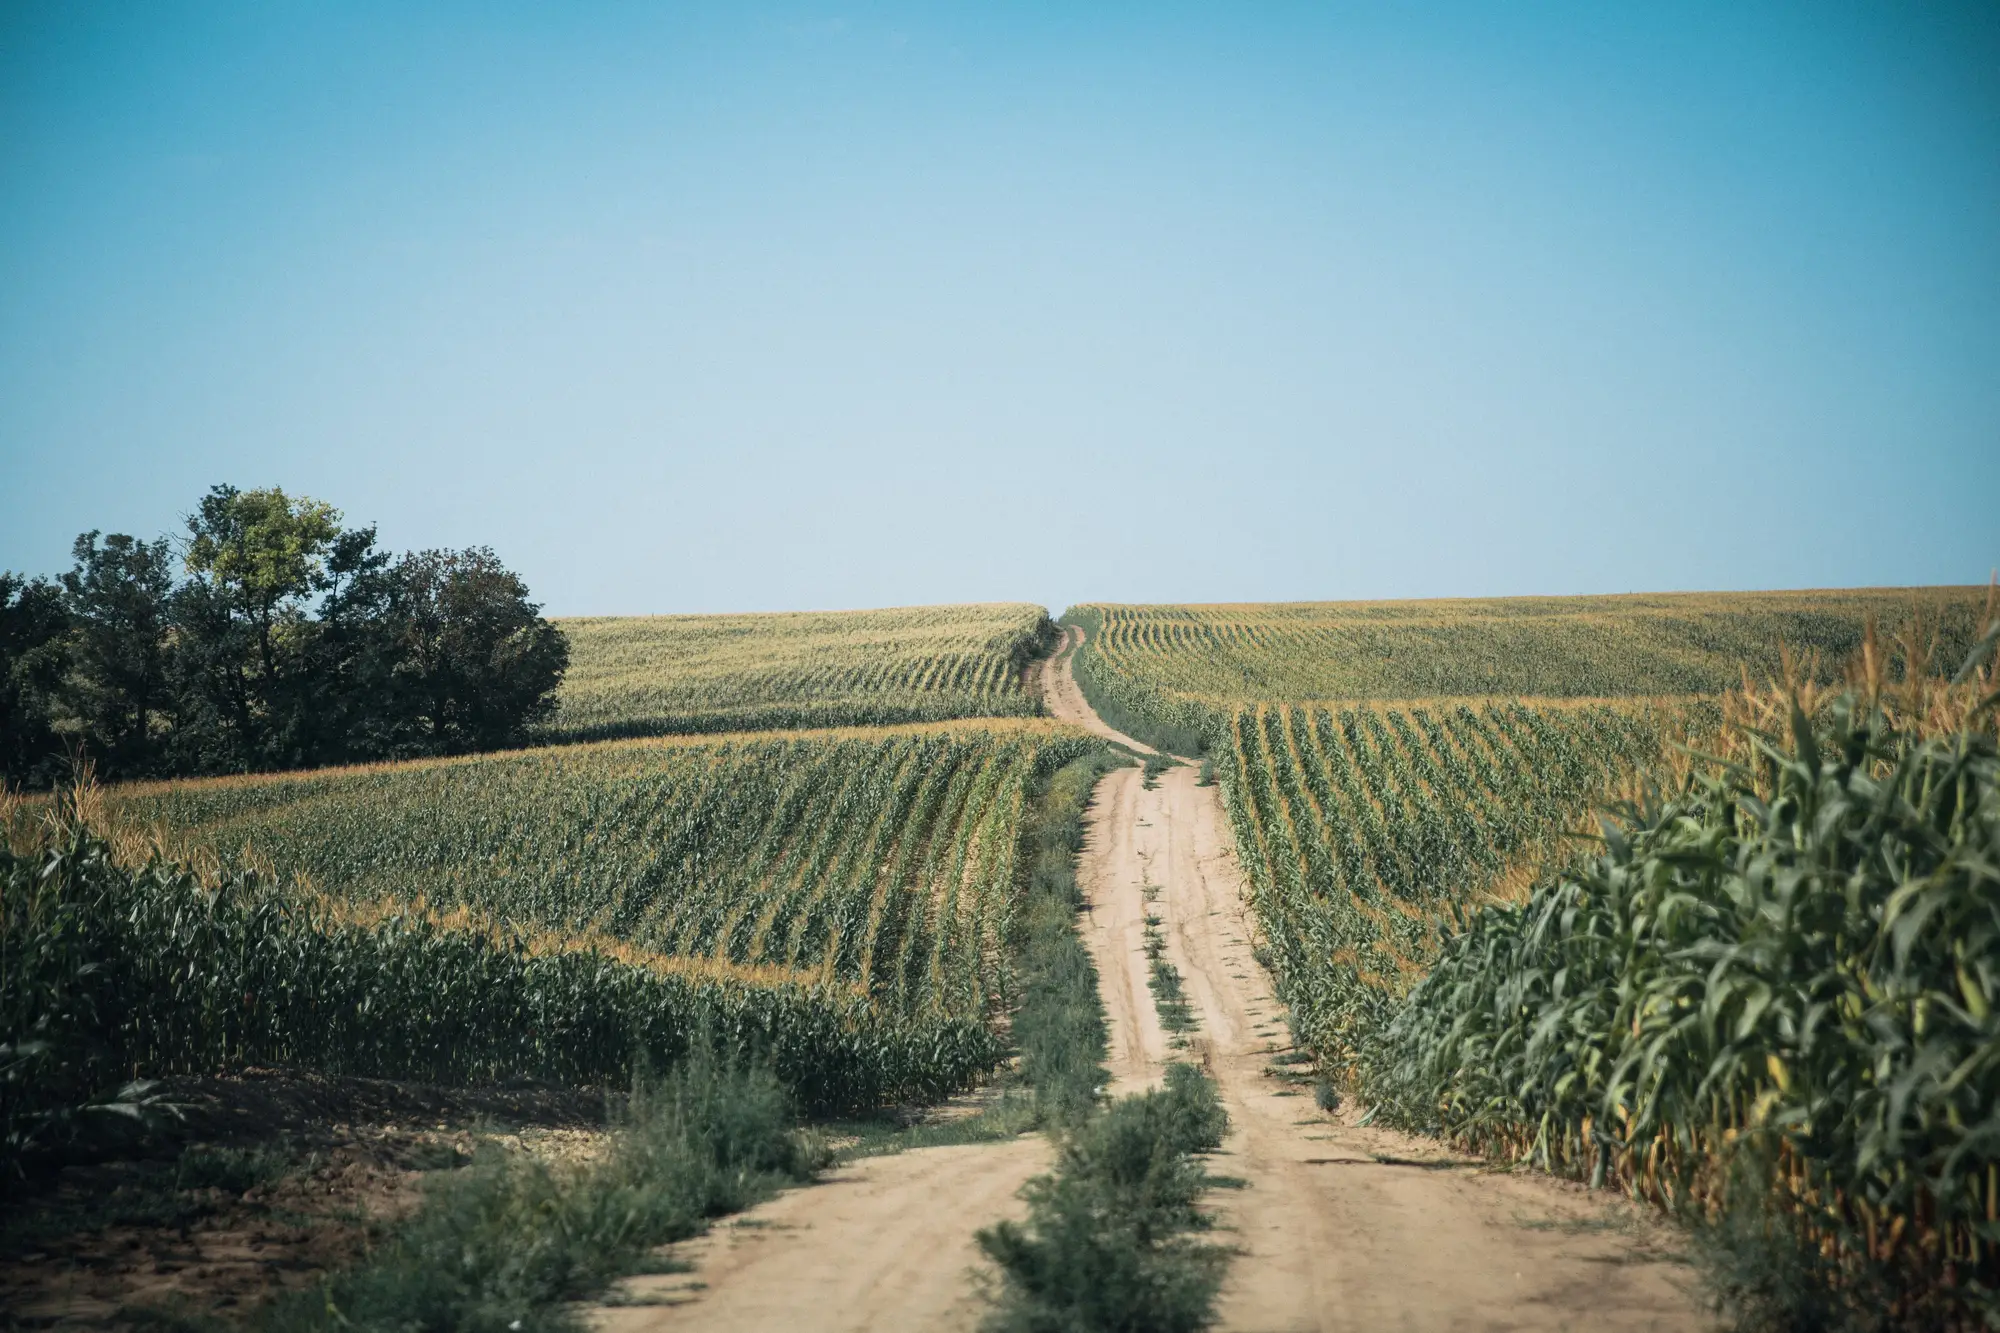 Field notes: the fence line that split one client's stress map in half
A straight stress line down the middle of a client's pivot turned out to trace an old fence row, not a soil boundary. Here's how we read it.
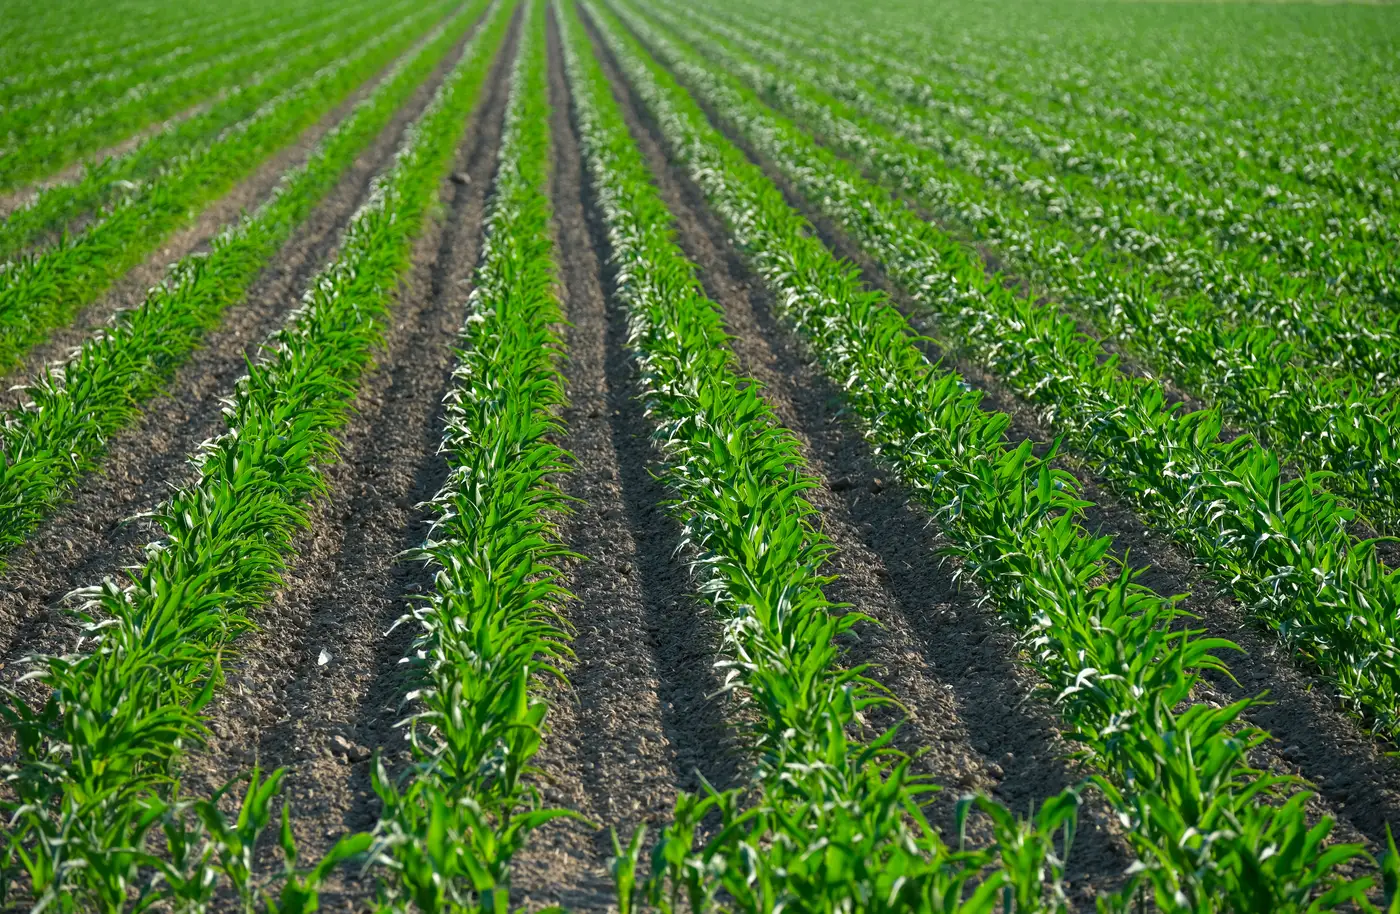 Compaction stress vs. drought stress in corn: how to tell them apart
How to separate compaction stress from drought stress in corn using root digs, wheel track patterns, and sidewall checks.
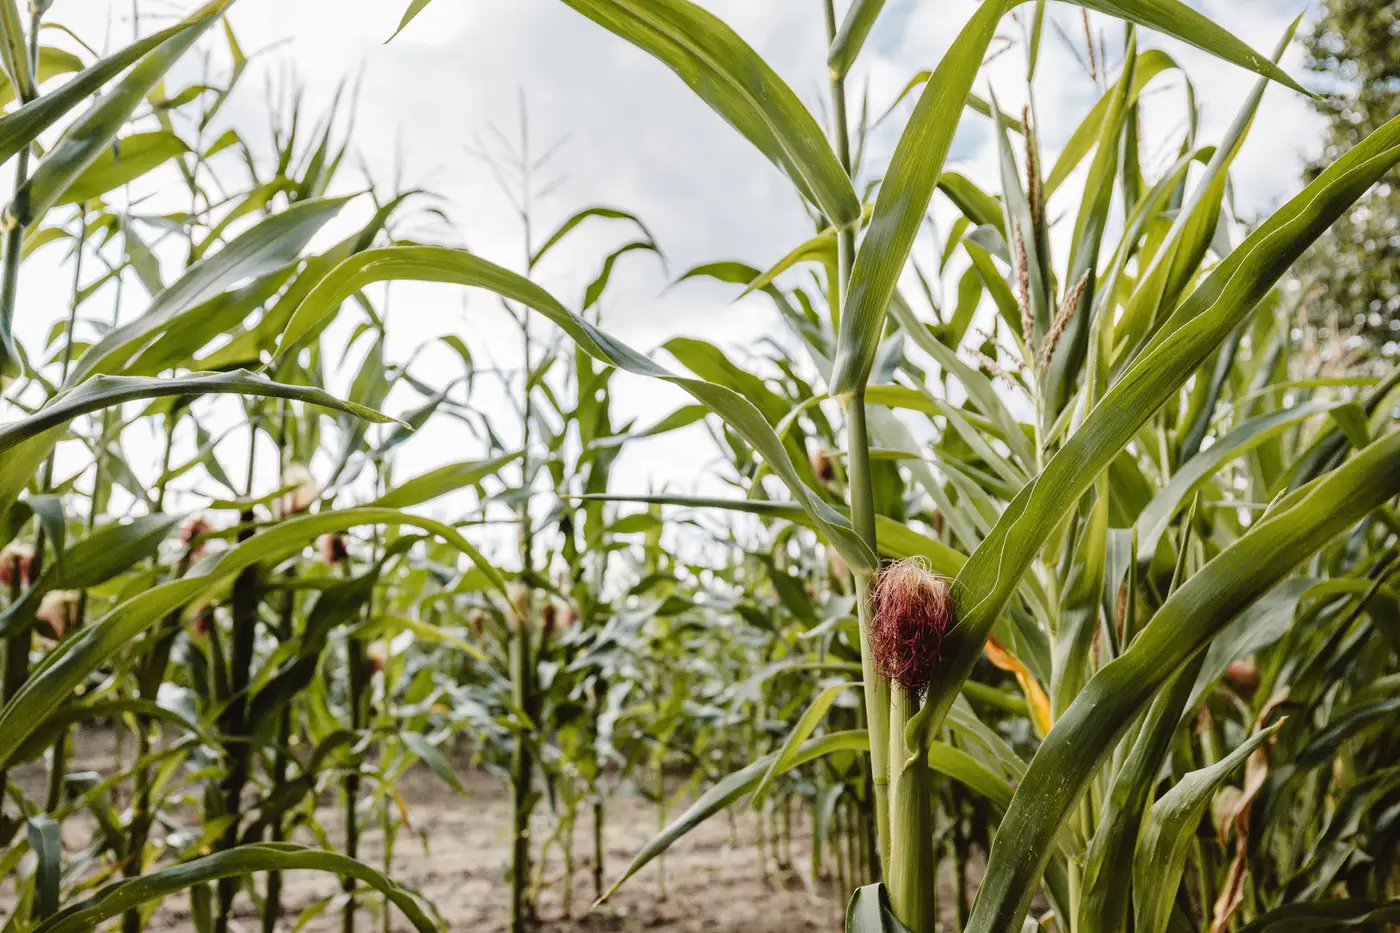 How often should you fly a field during grain fill?
Grain fill stress timing explained: why weekly imagery catches nitrogen, water, and salinity stress that a biweekly or monthly interval misses.
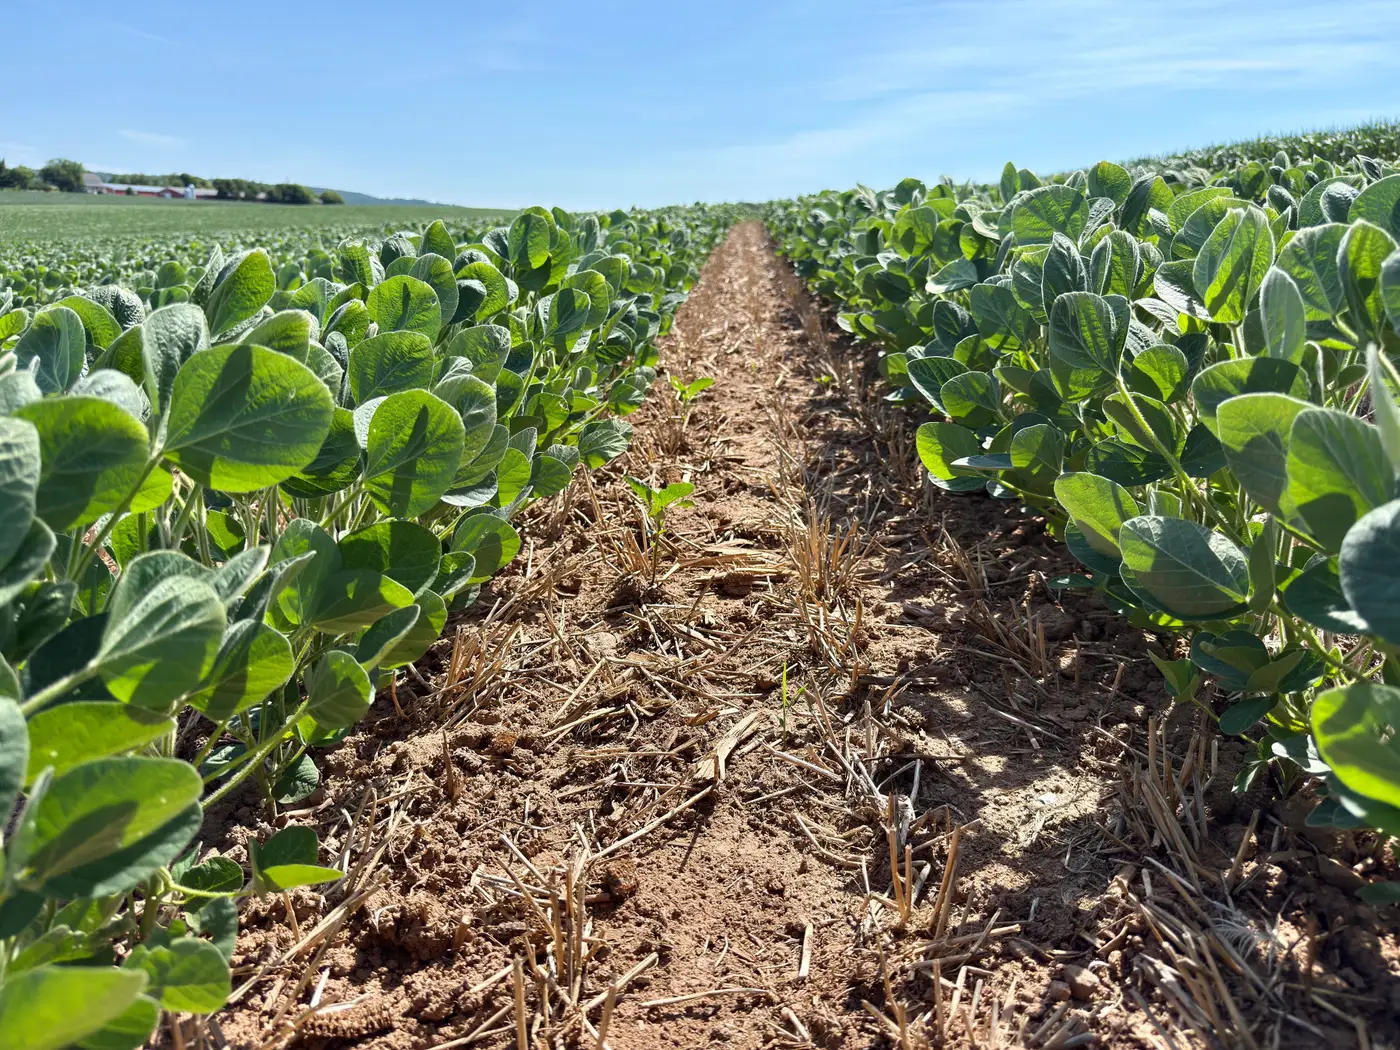 Zinc vs iron deficiency: reading the difference in the field
Zinc and iron deficiency both show as interveinal chlorosis, but the pattern and plant position differ. Here's how to tell them apart before you scout.
- Field notes: the client who didn't believe the map until he walked the spot himself
A consultant's account of a grower who doubted a stress flag until he put boots in the dirt, and what it taught about trusting a weekly read.
 Sulfur vs. nitrogen deficiency: telling them apart before you walk the field
Why nitrogen and sulfur deficiency read alike in canopy imagery, and the leaf-position check that tells them apart in the field.
- Explaining a vegetation stress map to a client who's never seen one
A field-tested way to walk a grower through their first NDVI or red-edge stress map without losing their trust in the first five minutes.
- Soil test vs. tissue test for nutrient stress: what each one tells you
Soil test or tissue test when a field looks off? How each one works, when to pull petiole samples, and what lab turnaround means for your scouting list.
- Field notes: the week a dry spell made every field look the same
A dry stretch flattens the visual differences between fields. Field notes on why windshield scouting breaks down and what still separates the causes.
- Potassium deficiency vs. water stress in soybean leaves: telling them apart
Potassium deficiency and water stress both yellow soybean leaves, but the pattern on the plant and across the field gives it away.
- Potassium vs magnesium deficiency in soybean leaves
Potassium and magnesium deficiency both cause interveinal chlorosis in soybean. Here's how the leaf pattern and field history tell them apart.
- Tissue test vs imagery: when you still need to pull leaf samples
Imagery narrows down the fields. Here's when a stress zone still needs a petiole sample or dry leaf tissue test before you call it.
- How to build this week's scouting priority list from a stress map
A field-by-field method for turning a weekly stress map into a ranked, driveable scouting list, sorted by cause, not color.
- Herbicide drift or nutrient stress? Reading the canopy right
How to separate herbicide drift symptoms from nitrogen deficiency in the field, using leaf position, pattern, and timing instead of a guess.
- Nitrogen stress vs. drought stress in corn: telling them apart from the cab
How to tell nitrogen stress from drought stress in corn by leaf position, timing, and field pattern before you walk the row.
- Interveinal chlorosis in corn: causes and what it means
Yellowing between the veins in corn leaves can mean iron, manganese, or sulfur trouble. Here's how to tell them apart before you write it up.
- Red edge vs NIR: what each band actually tells you about crop stress
Red edge and NIR imagery flag different kinds of crop stress. Here's what each band measures and why you need both to separate the causes.
- What causes salinity stress in soybean and corn fields
A field-level look at what pushes salts up into the root zone, how salt stress reads in beans versus corn, and how to tell it from drought or N.