Potassium deficiency vs. water stress in soybean leaves: telling them apart
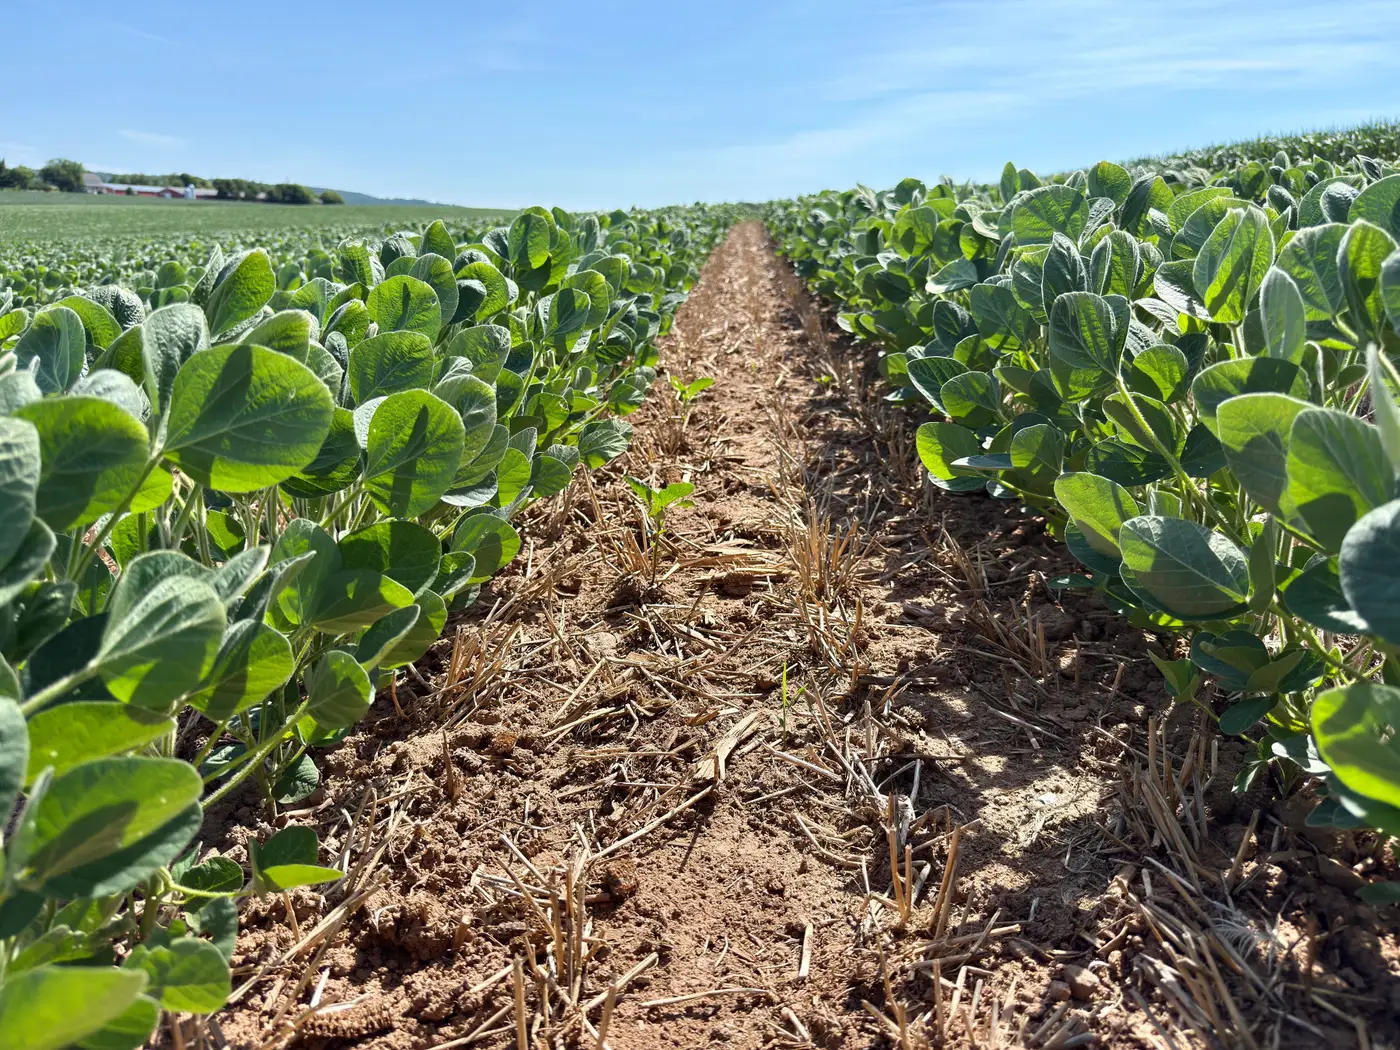
Both show up as a soybean field that looked fine two weeks ago and now has a yellow cast from the truck. Both get worse in August heat. And both get blamed on "drought stress" by someone driving past at 55 mph. The two causes need opposite fixes, though, so the five minutes it takes to walk into the field and look a leaf over is worth it.
Where on the plant it starts
Potassium is mobile inside the soybean plant. When supply runs short, the plant pulls K out of older leaves and ships it to new growth, so deficiency symptoms almost always start in the lower canopy first and move up as the season goes on. You'll see yellowing along the leaf margin while the center of the leaflet and the veins stay green, and in a bad case that margin goes brown and crispy, like someone scorched the edge with a lighter. That edge scorch is the single most useful tell.
Water stress doesn't respect a mobility rule like that. A droughted plant can show symptoms top to bottom at once, or even hit the upper canopy hardest because those leaves are catching full sun with no canopy shade below them. Leaflets roll inward or flip to show the pale underside, and the whole plant takes on a dull, grayish-green look rather than the clean yellow-with-green-veins pattern of K deficiency.
What the field pattern tells you
Walk the field edge to edge instead of just the one spot that caught your eye. Potassium deficiency tends to track soil texture and CEC: sandy knolls, eroded ridges, old fence-line cuts, anywhere the K-holding capacity dropped out. If you pull up a soil test map and the yellow patches line up with the low-K zones from three years ago, that's your answer before you even cut a stem. Water stress tracks something different: elevation, compaction, a hardpan from a wet spring, or the whole field at once if it just hasn't rained.
One more field check worth doing: come back in the evening or early the next morning. A water-stressed plant that got relief overnight, or even just cooled off, will often look noticeably better by 7 a.m. A potassium-deficient plant looks the same at dawn as it did at 2 p.m., because the problem isn't moisture, it's supply.
Tissue testing is still the way to close the loop once you've narrowed it down, but you don't need to pull samples on every yellow patch in the county to figure out which ones are worth the lab fee. The leaf position, the margin pattern, and whether the symptom lines up with old soil-test zones will tell you which fields to sample and which ones just need a rain.
This is also exactly the kind of call that's hard to make from the truck window on a route with fifteen fields on it, which is the gap a weekly red-edge and NIR pass is built to close, separating a nitrogen pull from a moisture pull from a salinity pocket before you ever walk a row, as this kind of weekly field read is built to do. It doesn't replace the tissue test, but it tells you which three fields on your list actually need one this week instead of all fifteen.
One more thing worth flagging for clients: leaf edge scorch isn't exclusive to potassium. Chloride toxicity, certain herbicide injuries, and even severe late-season drought can produce a similar browned margin, so if the pattern doesn't match the soil-test map for K, don't assume you've found your answer just because the leaf looks "scorched." Cutting a few plants and checking the stem and pod set for secondary clues, like pods that are smaller or flatter than the rest of the field, helps rule those out.
If you're running a scouting route across a handful of farms and want the yellowing you spot on Tuesday already flagged by cause before you get out of the truck, that's the gap Crop Stress Map is built to close.